Urban Floods
Urban Floods Risk Assessment
Flood-risk composites for Lisbon and Potsdam compare 2-, 50-, and 100-year return periods in 2018 versus 2050, capturing how urban land-cover changes alter both exposure and protection. Click each panel to explore the full-resolution visuals while the dashboard narrative is finalized.
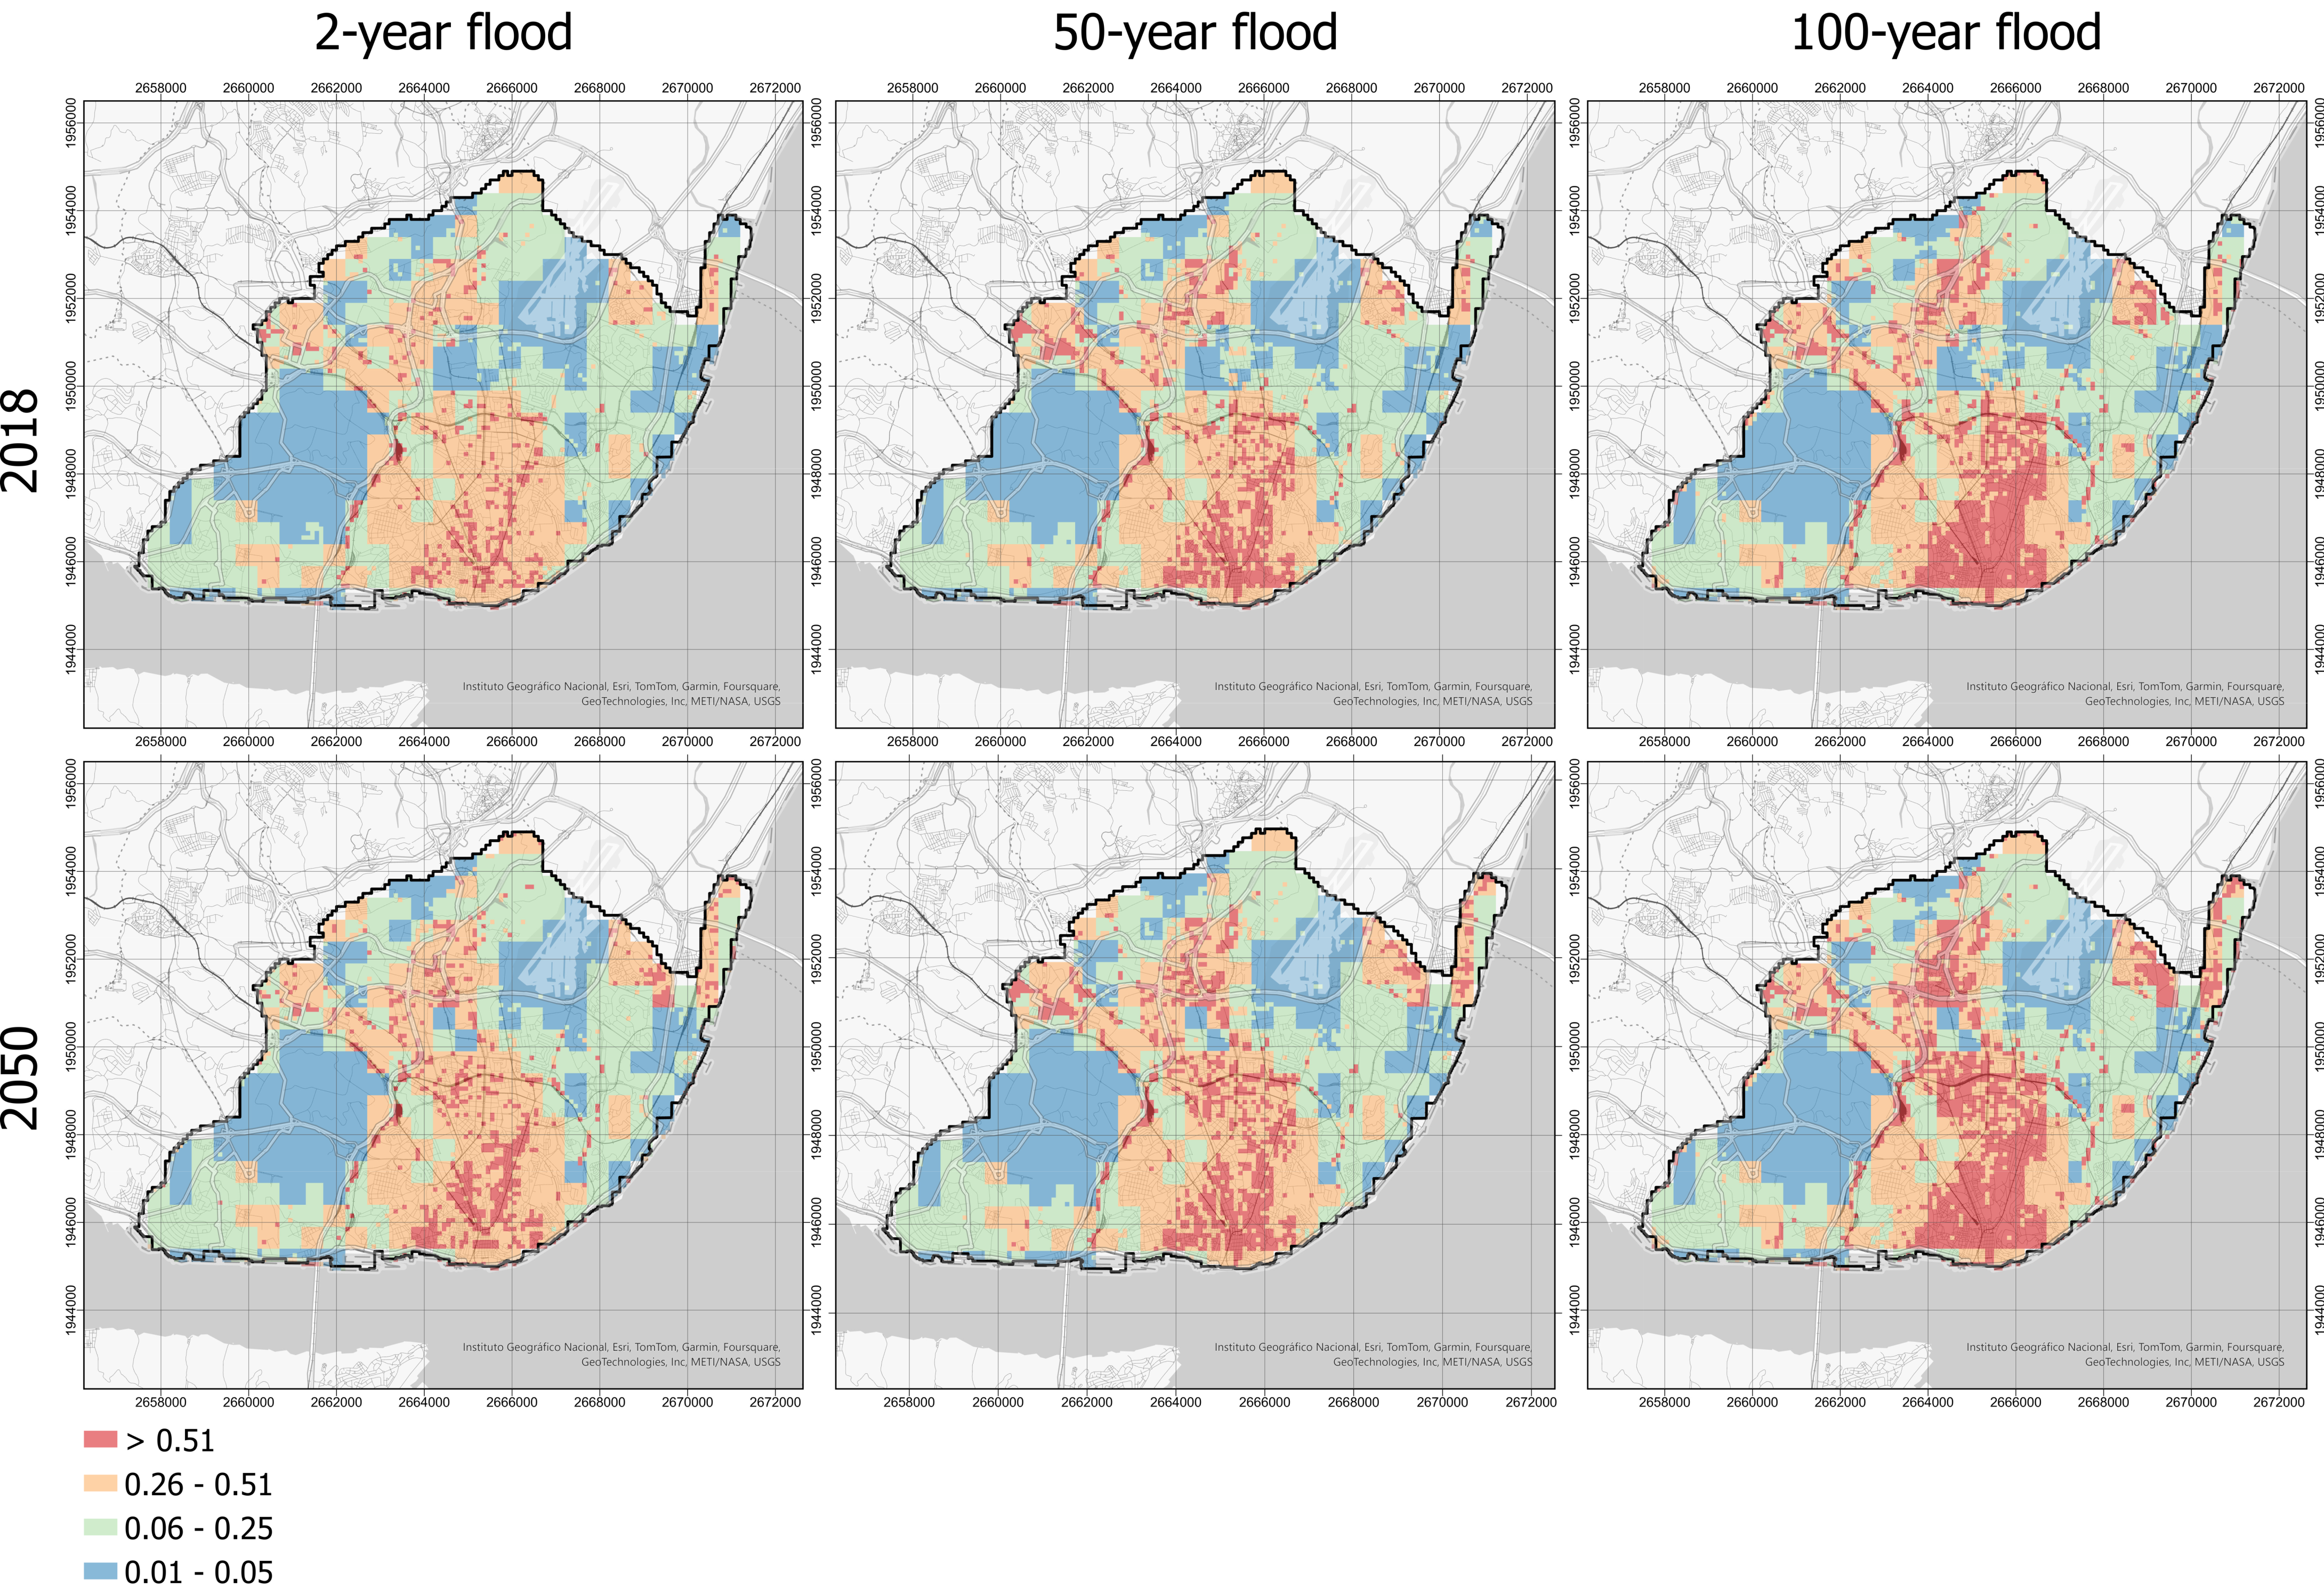
Flood risk maps for Lisbon for 2-, 50-, and 100-year return periods in 2018 and 2050 show how increased artificialization drives higher exposure across the city’s floodplains.
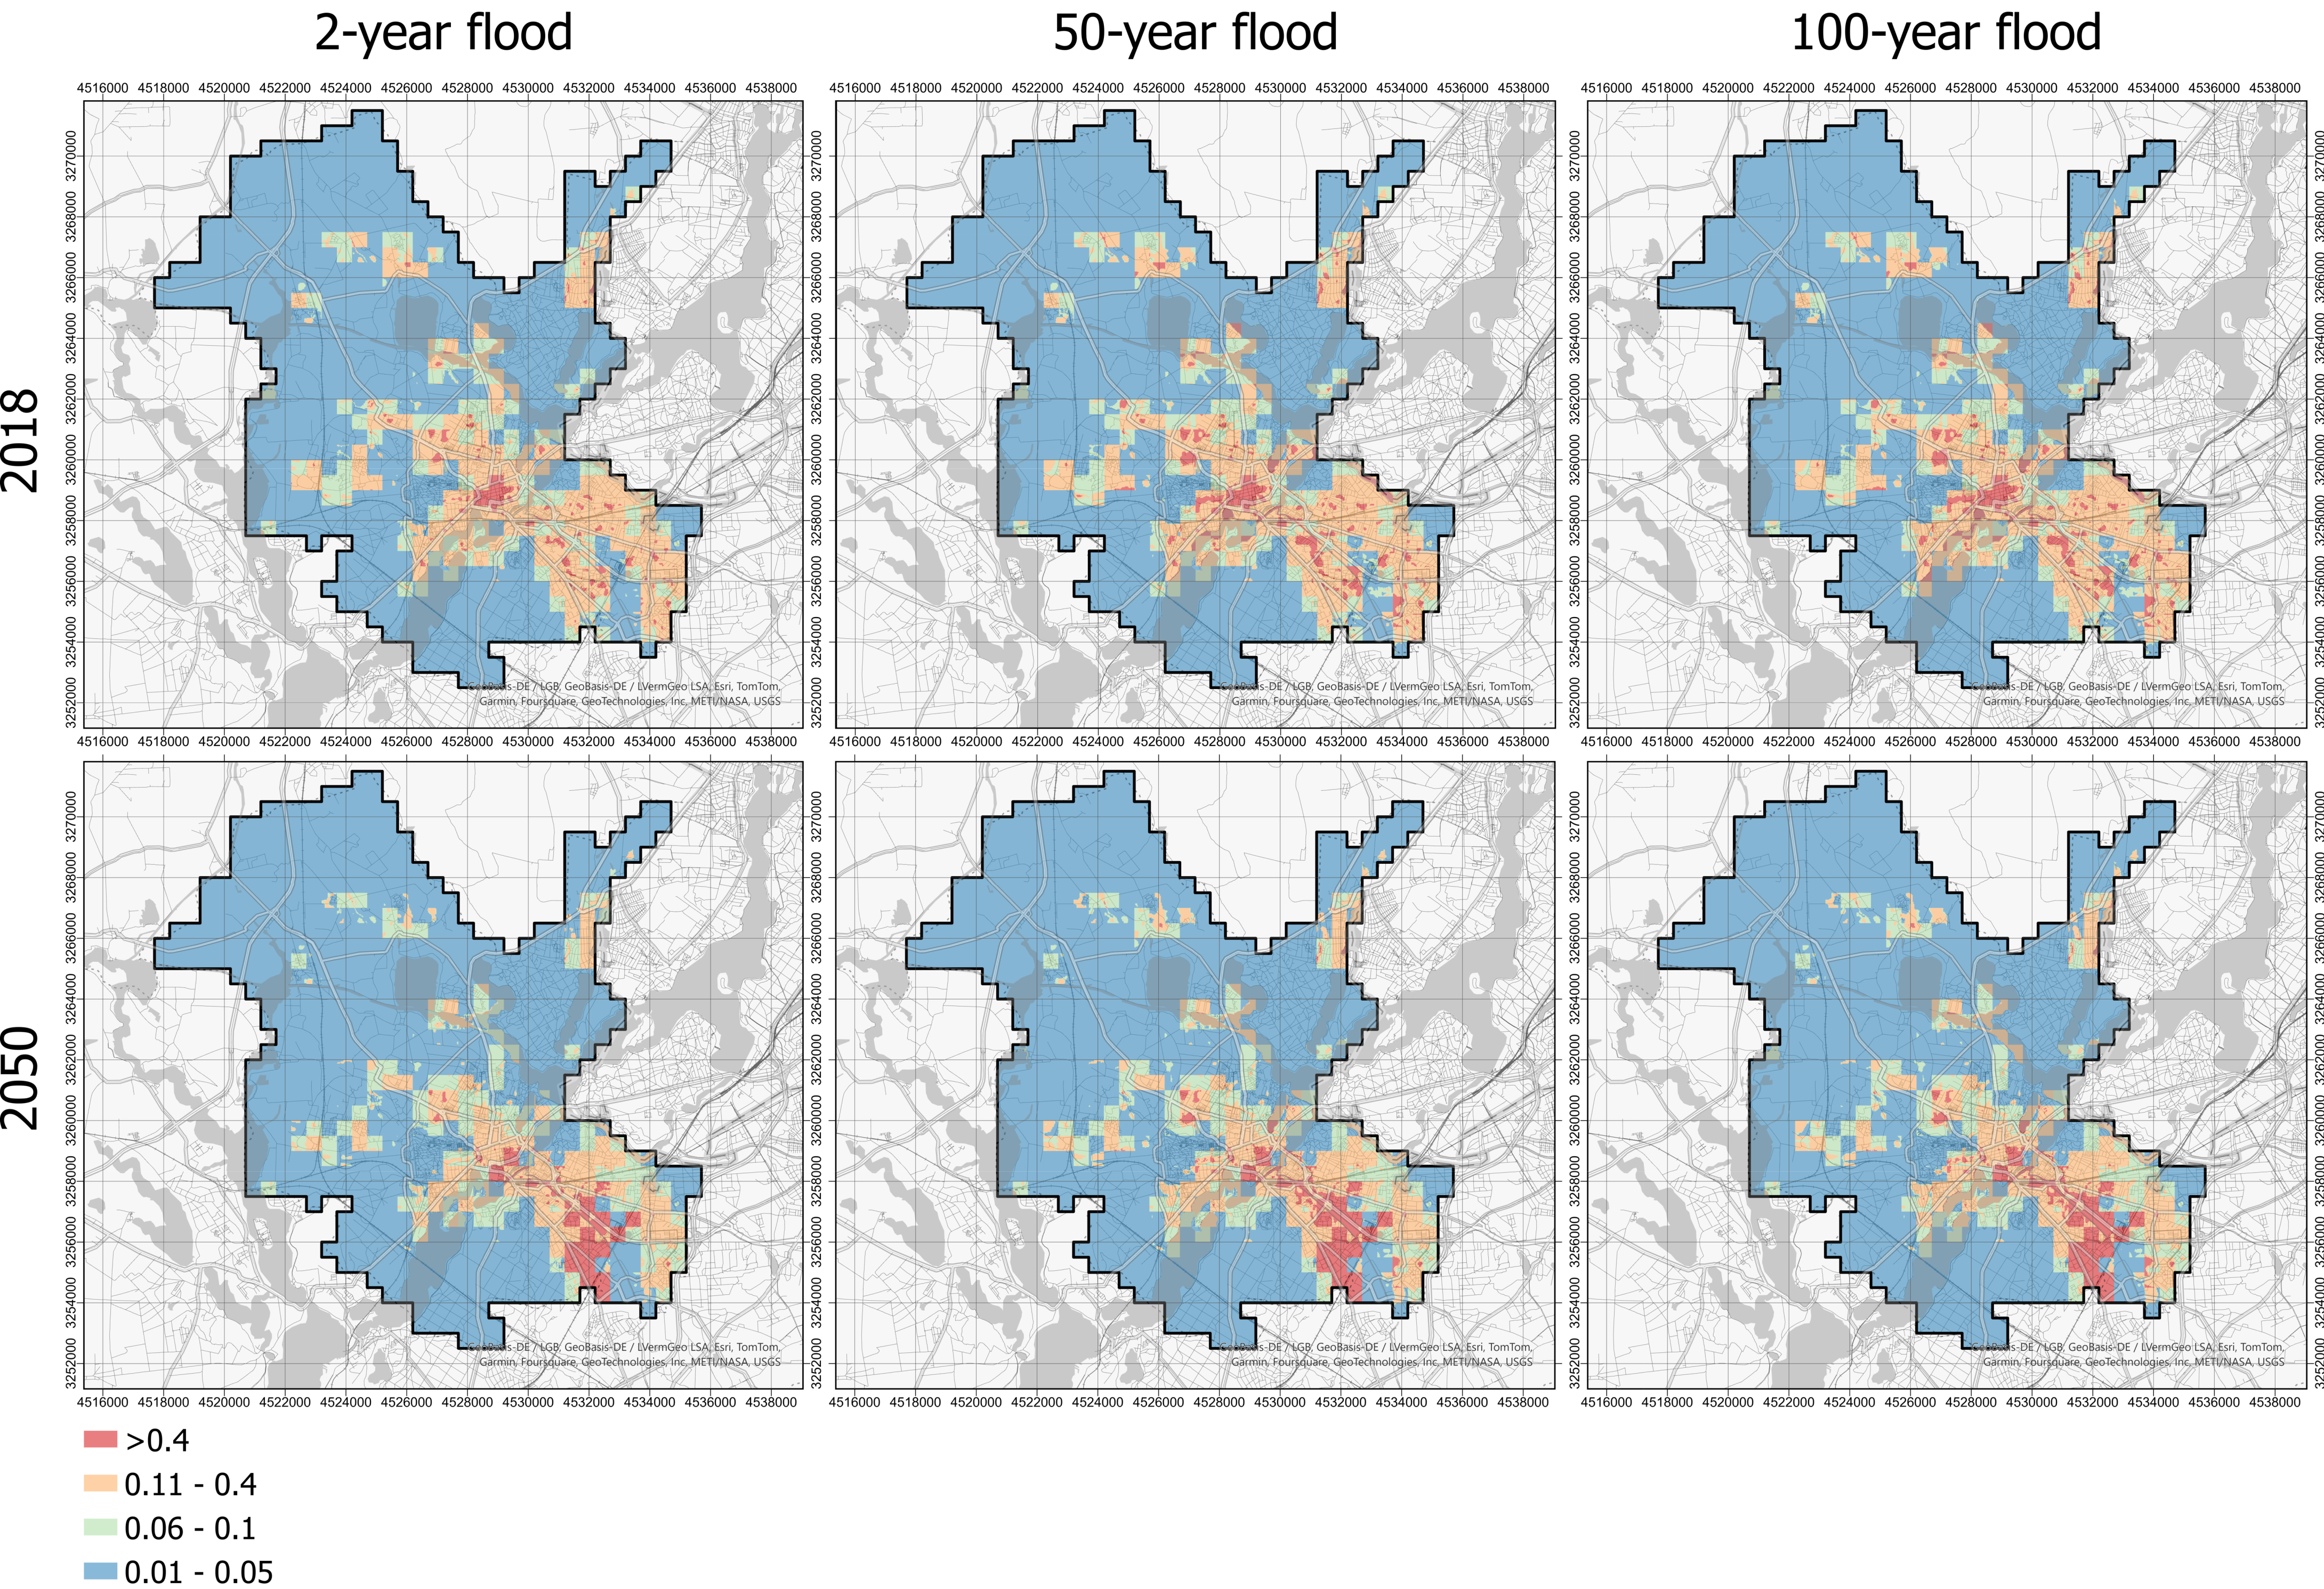
Potsdam’s 2-, 50-, and 100-year return-period maps highlight how land-cover change synchronizes losses in flood protection with the expansion of vulnerable zones through 2050.
Source: Elliot, T., Torres-Matallana, J. A., & Teebken, J. (2025). Urbanization under extreme climate events leads to synchronized decreases in flood protection and increases in vulnerability. Cities, 160, 105827. https://doi.org/10.1016/j.cities.2025.105827
- Posted on:
- November 1, 2025
- Length:
- 2 minute read, 216 words
- See Also: