Climate Projections
Luxembourg tas (Euro-CORDEX RCP2.6 vs RCP8.5)
Each plot shows how Luxembourg’s daily mean air temperature (tas) evolves through July for both the low-emissions (RCP2.6) and high-emissions (RCP8.5) scenarios. A Crameri-inspired blue→orange palette highlights cooler versus warmer days, while dual cumulative lines reveal how quickly each storyline stacks heat. Explore the synoptic maps first, then step through the time slices in chronological order to see how divergence accelerates through mid- and late-century climates.
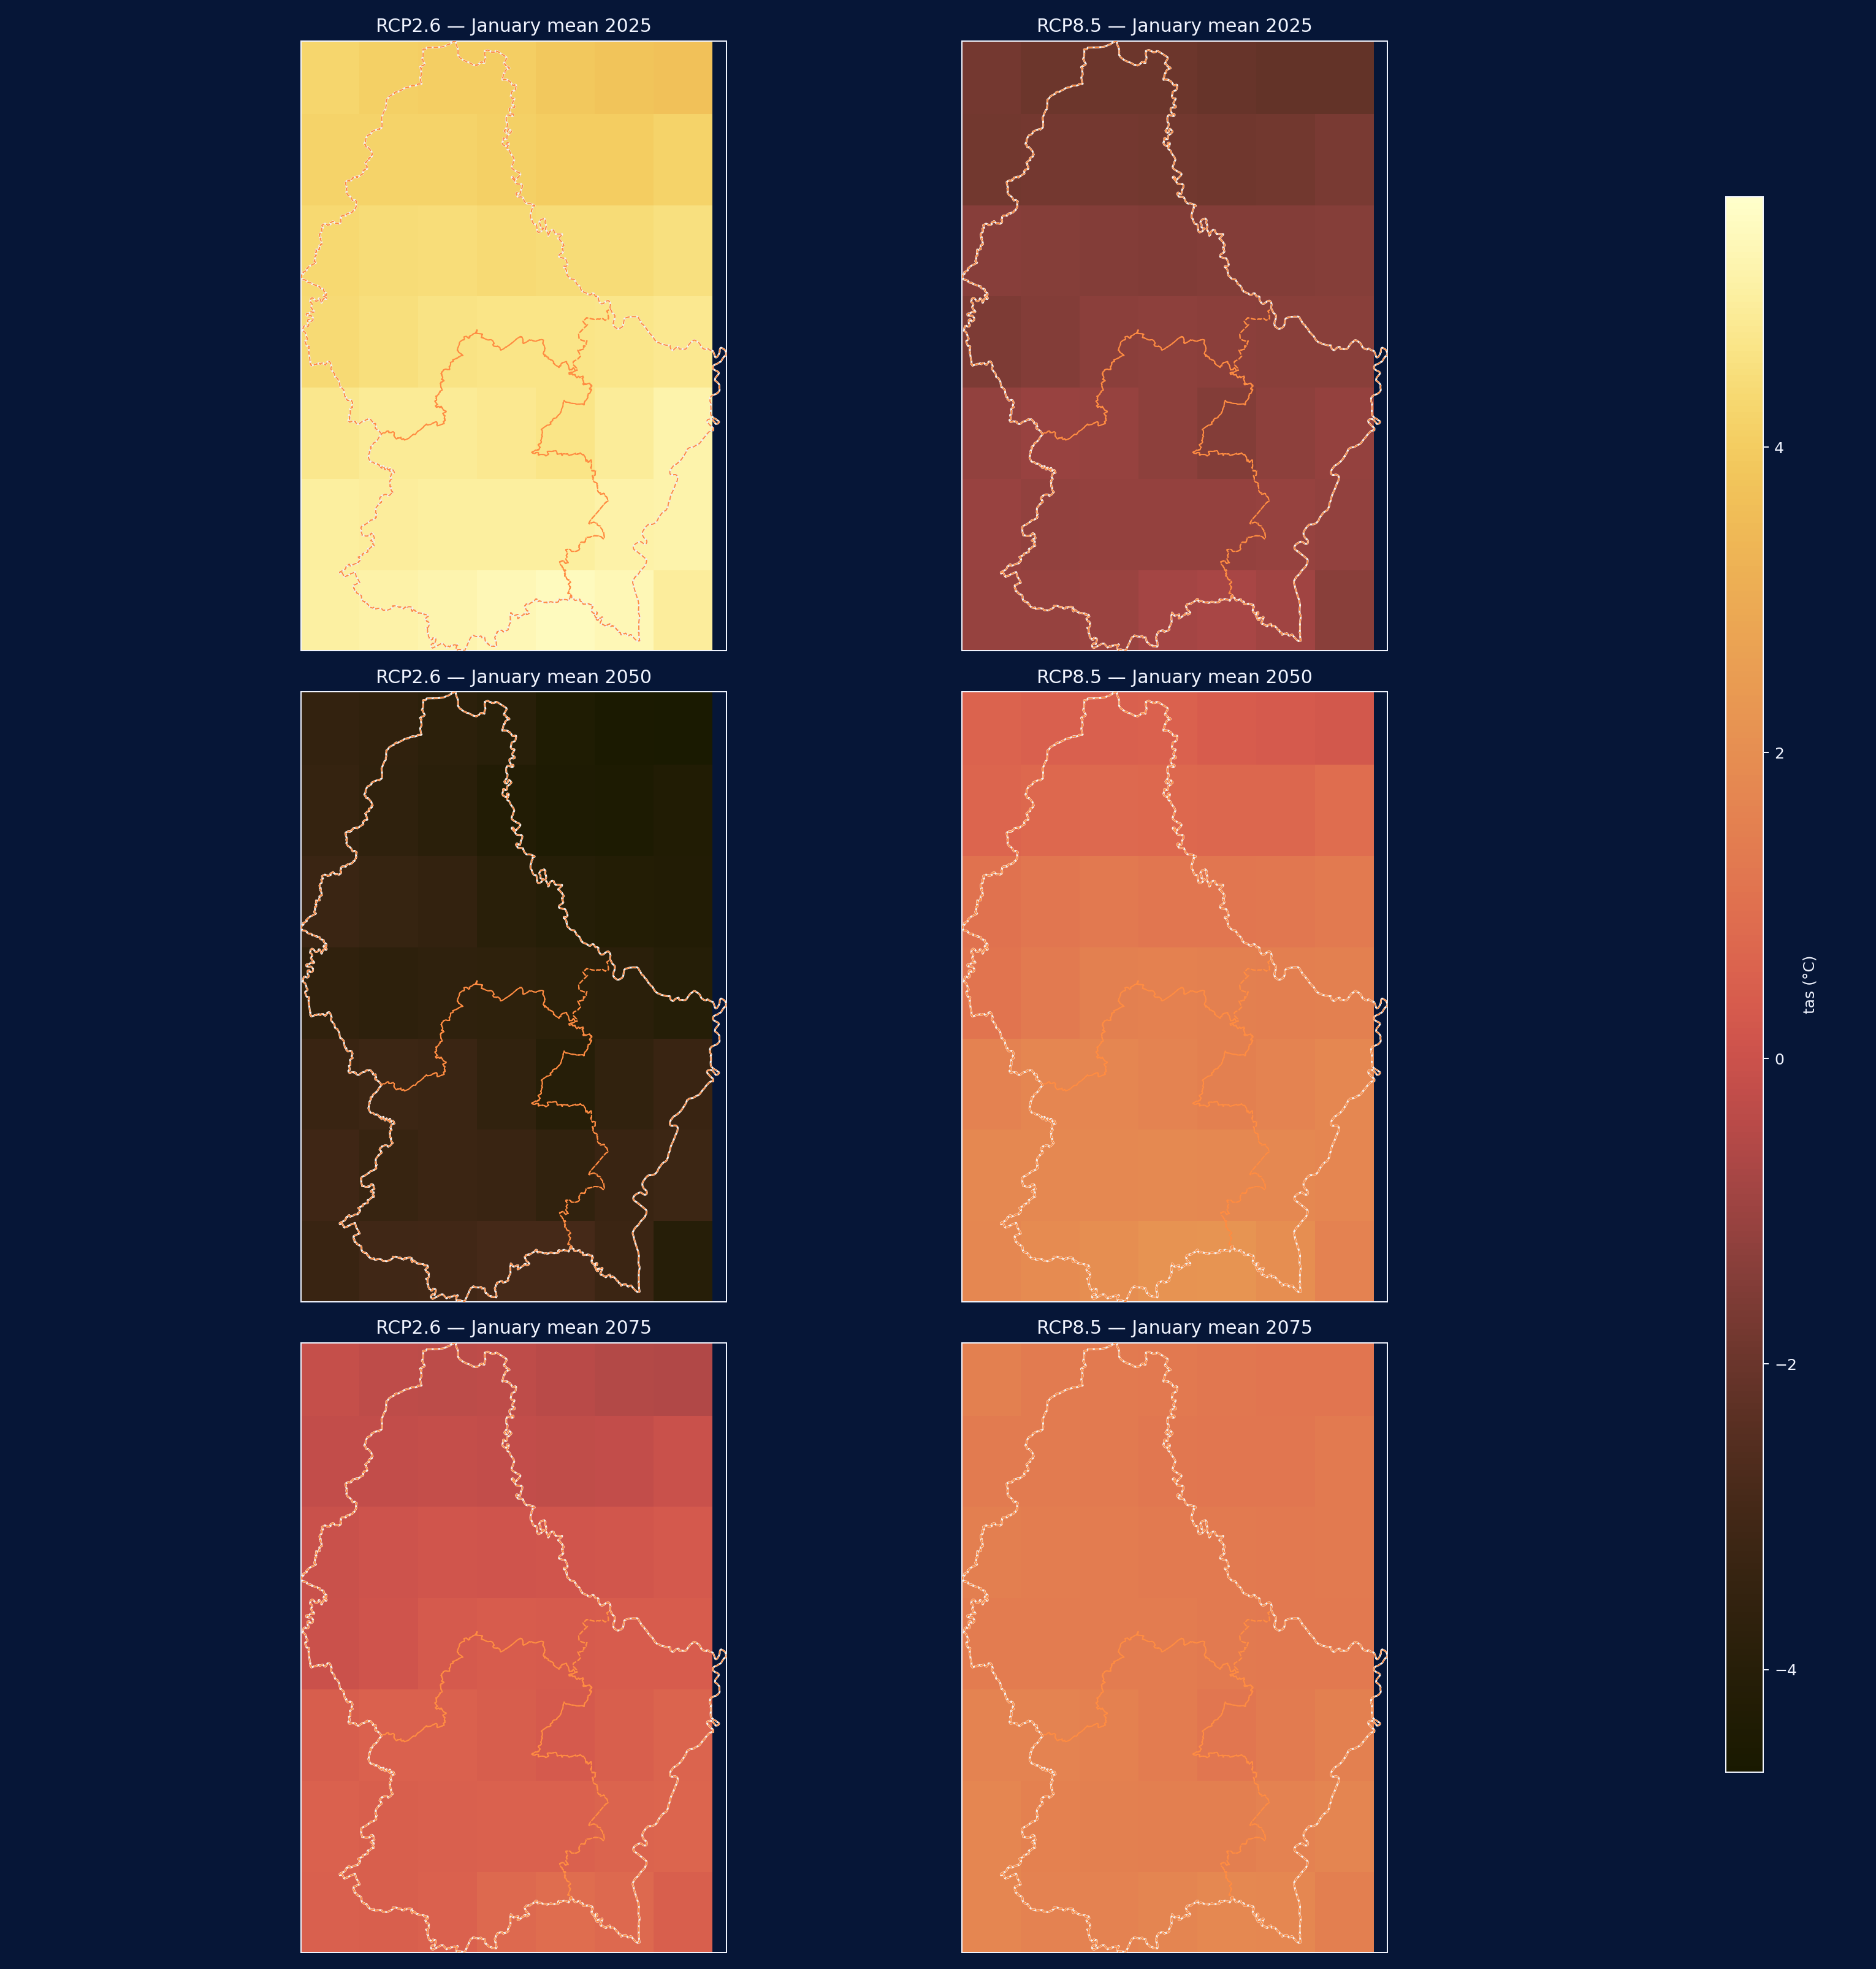
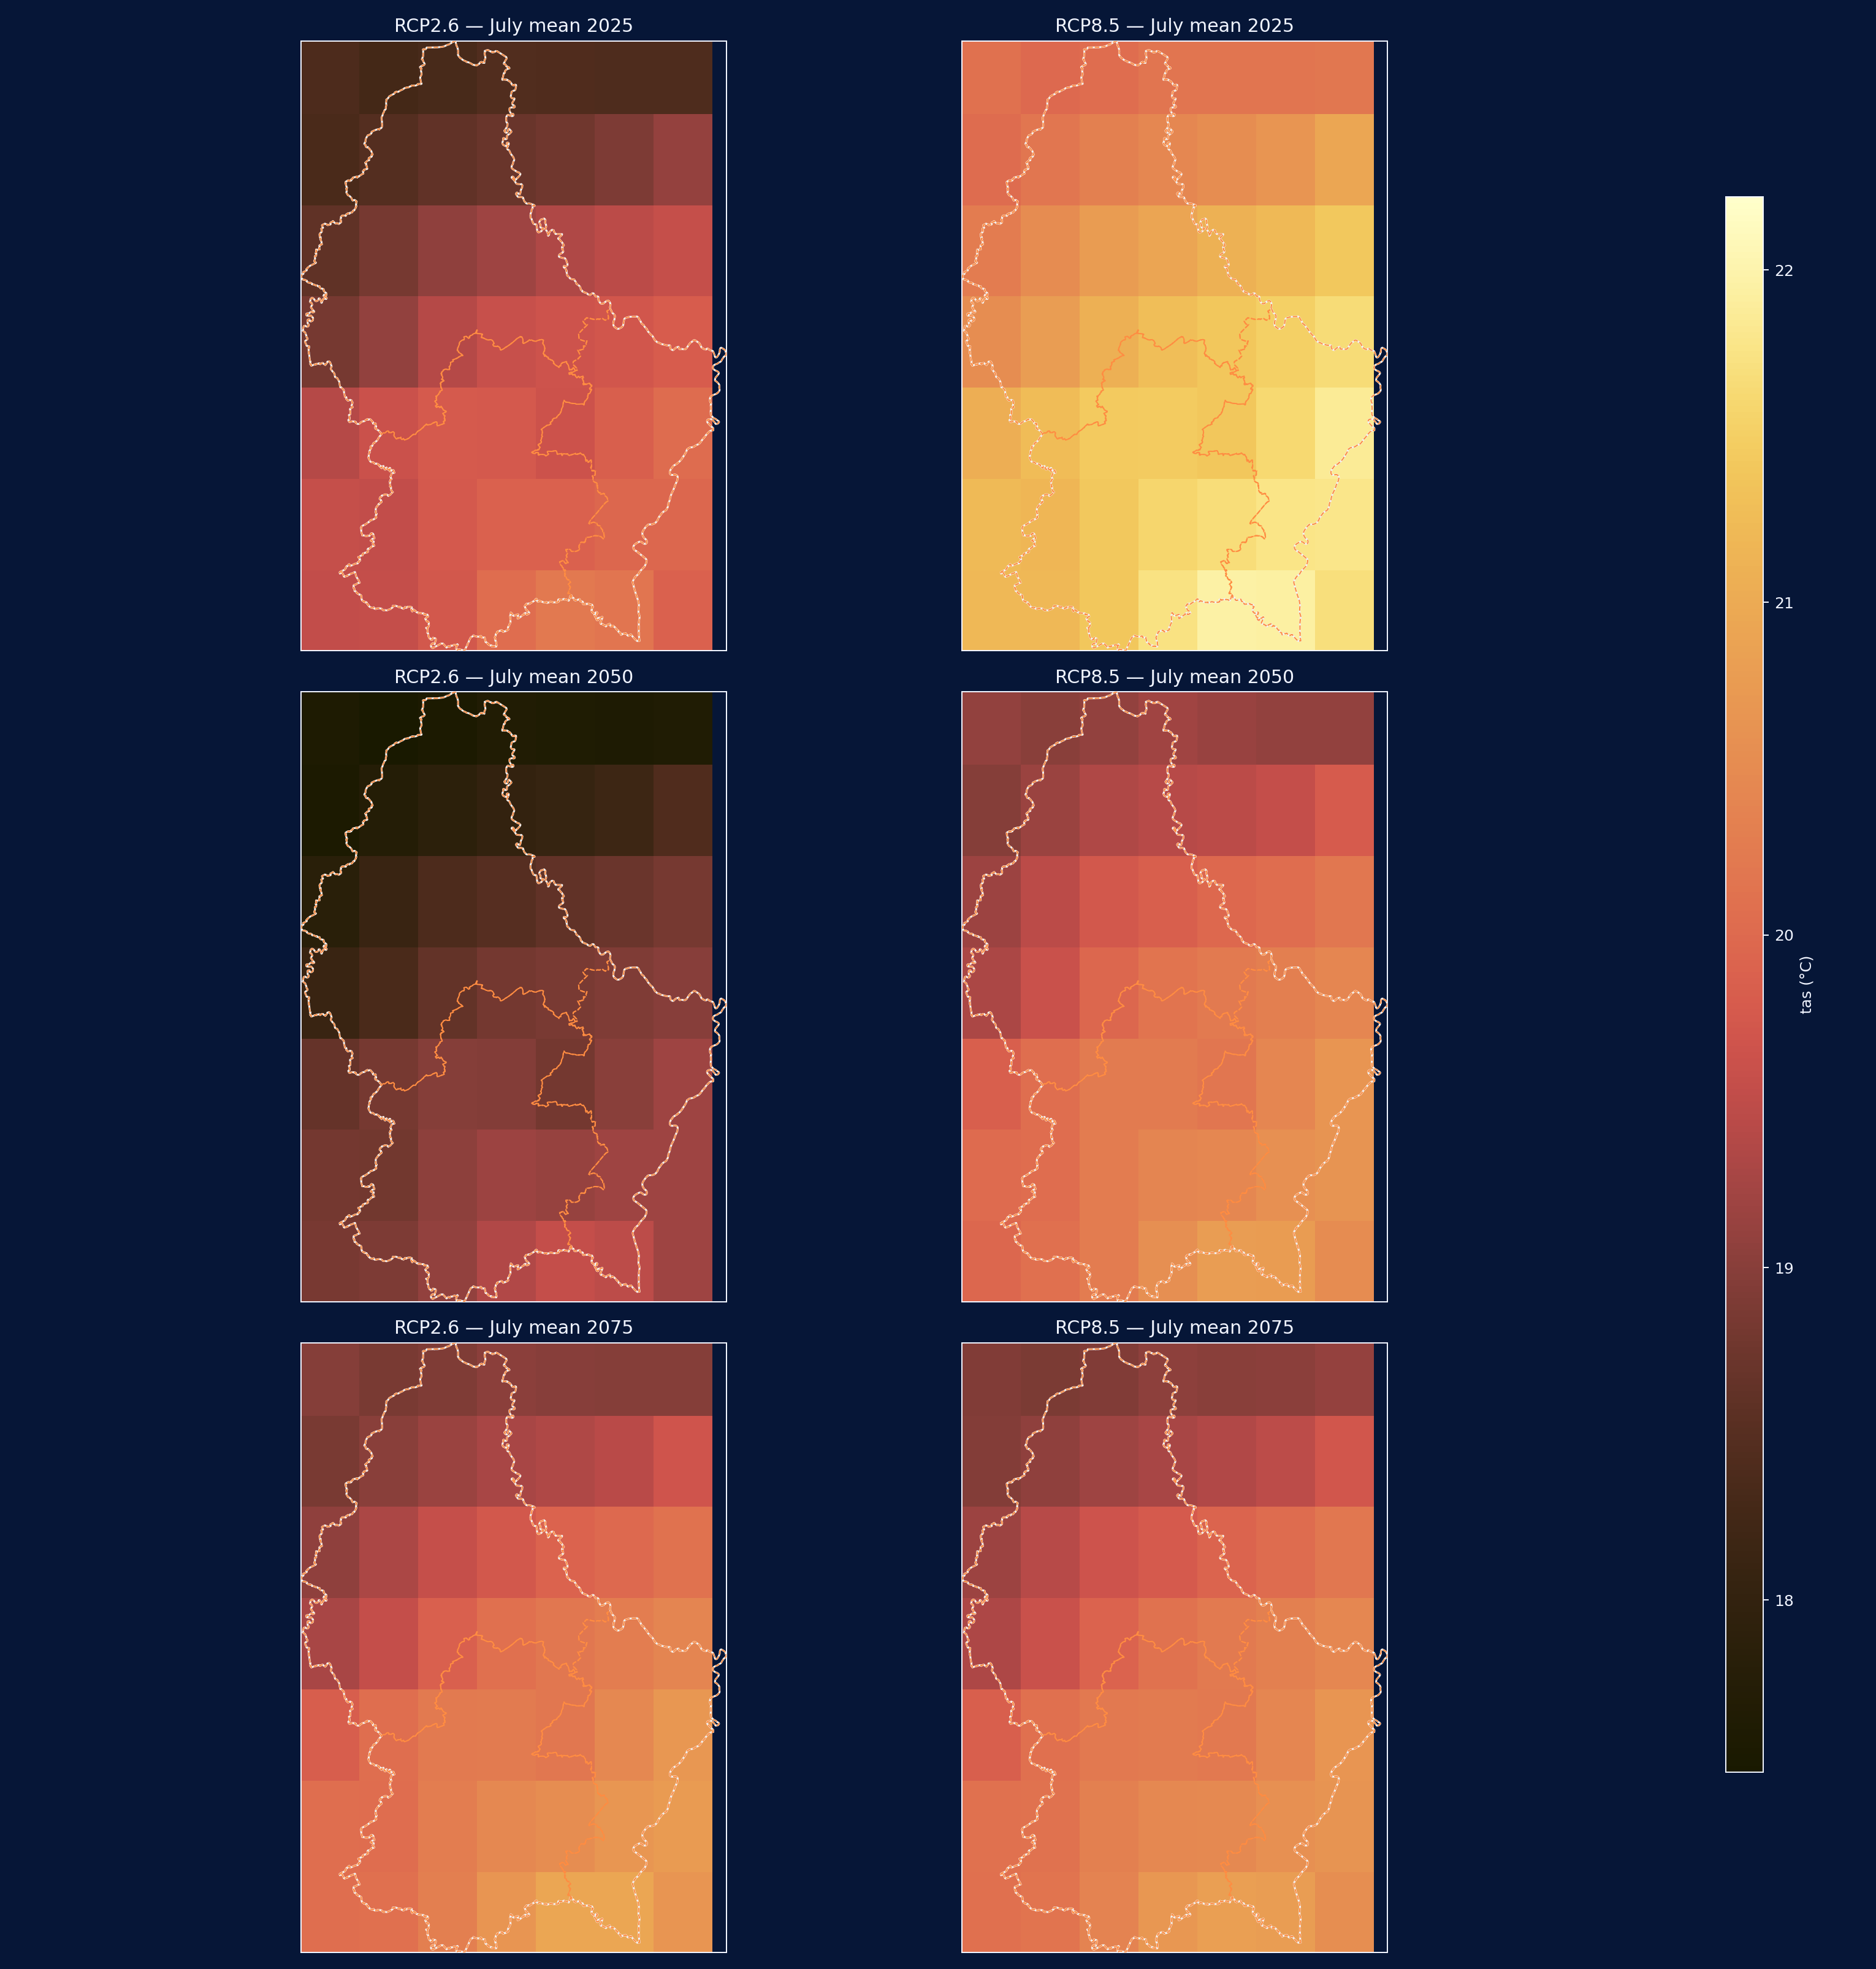
Spatial baseline (January vs July)
July 2025: Early divergence
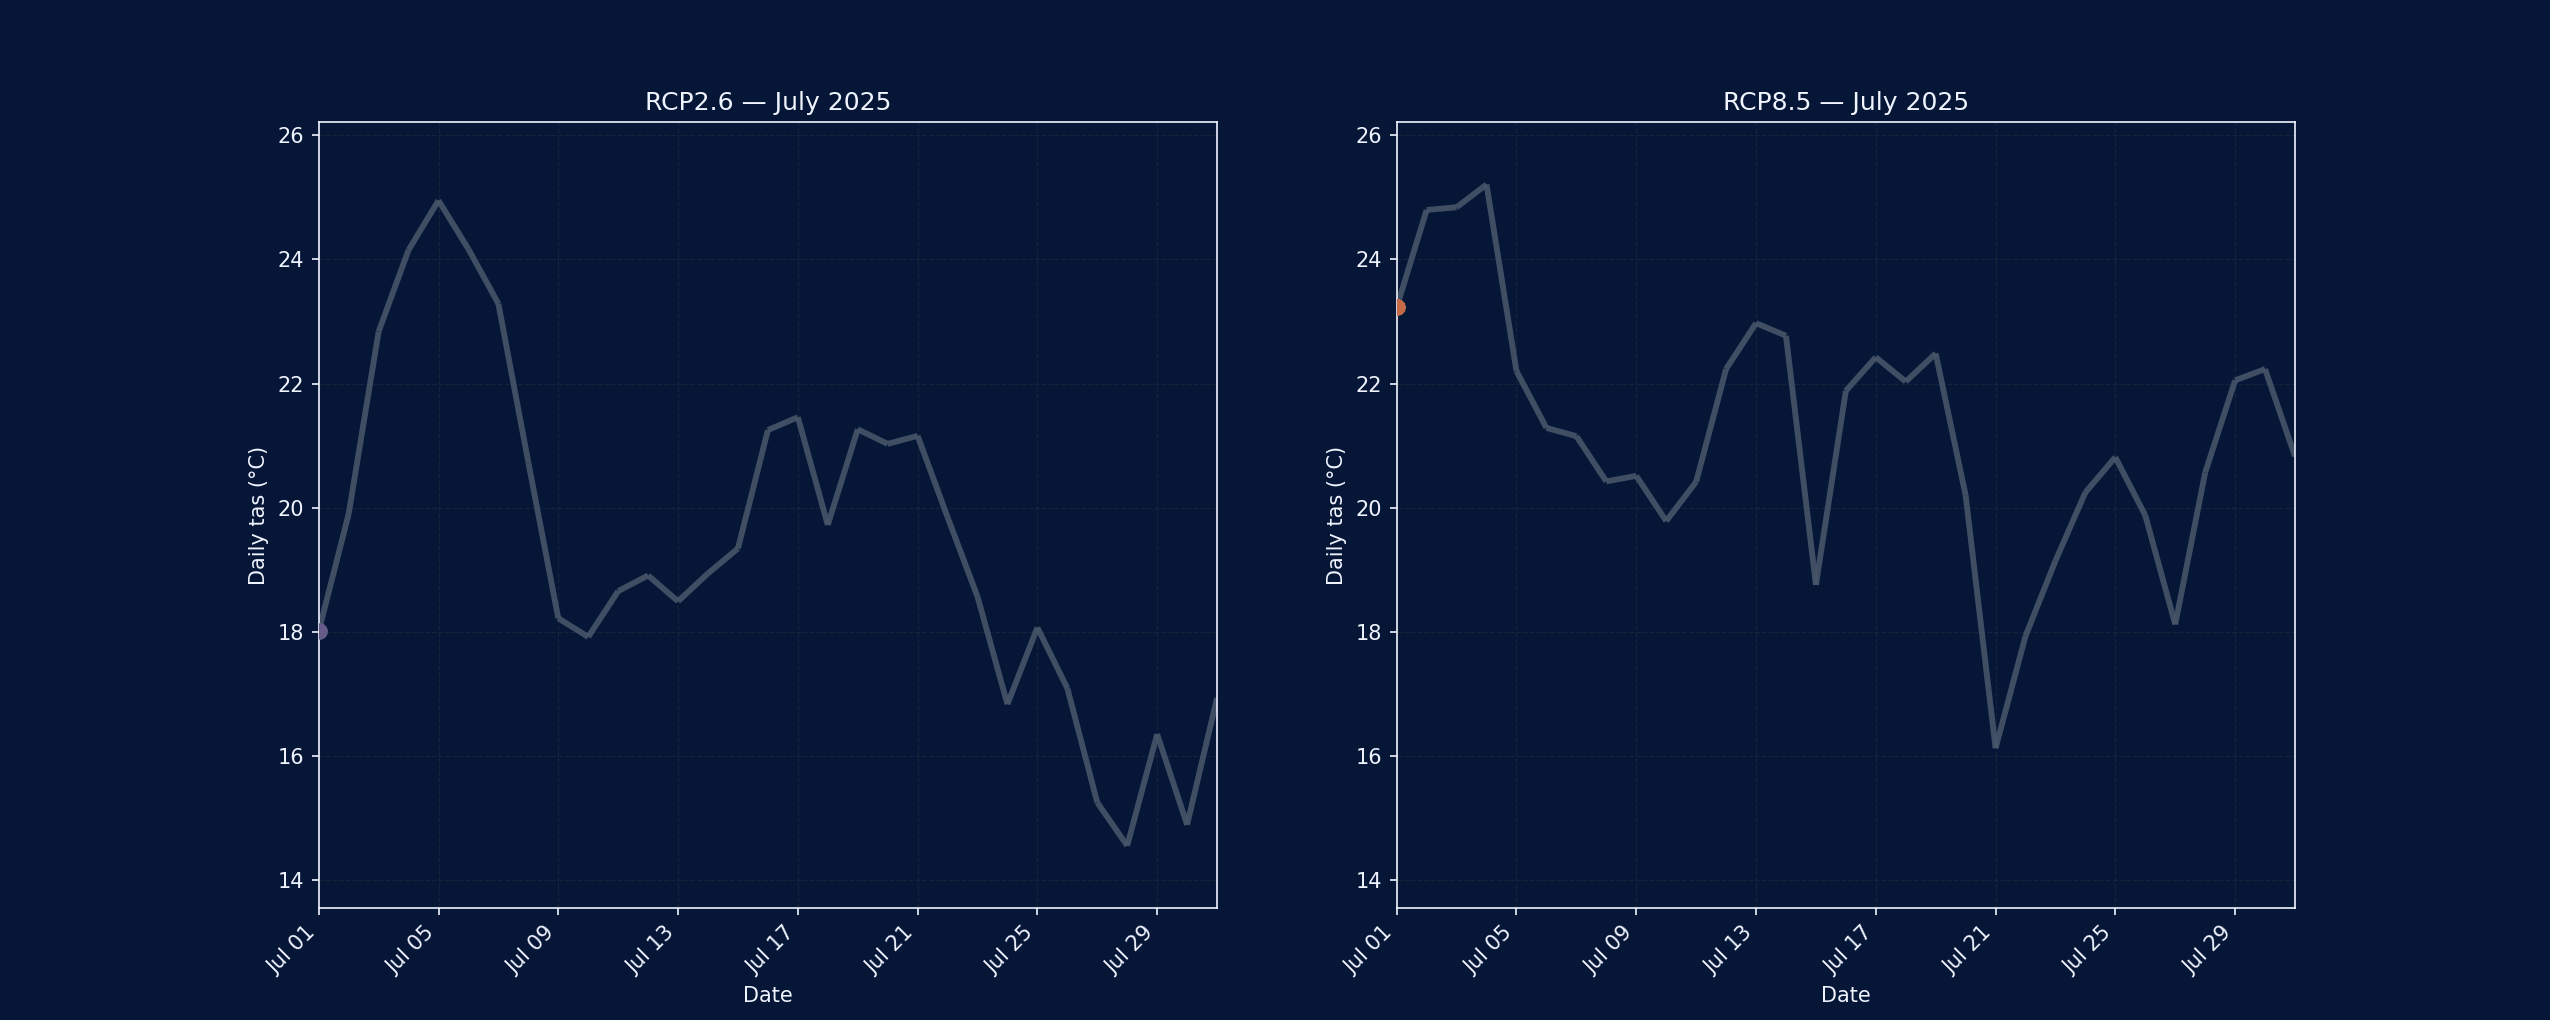
The 2025 trace serves as the near-term baseline. Both scenarios mostly overlap, but the RCP8.5 line already pushes slightly higher during heat pulses, hinting at the amplification that becomes obvious later in the century.
July 2050: Mid-century contrast
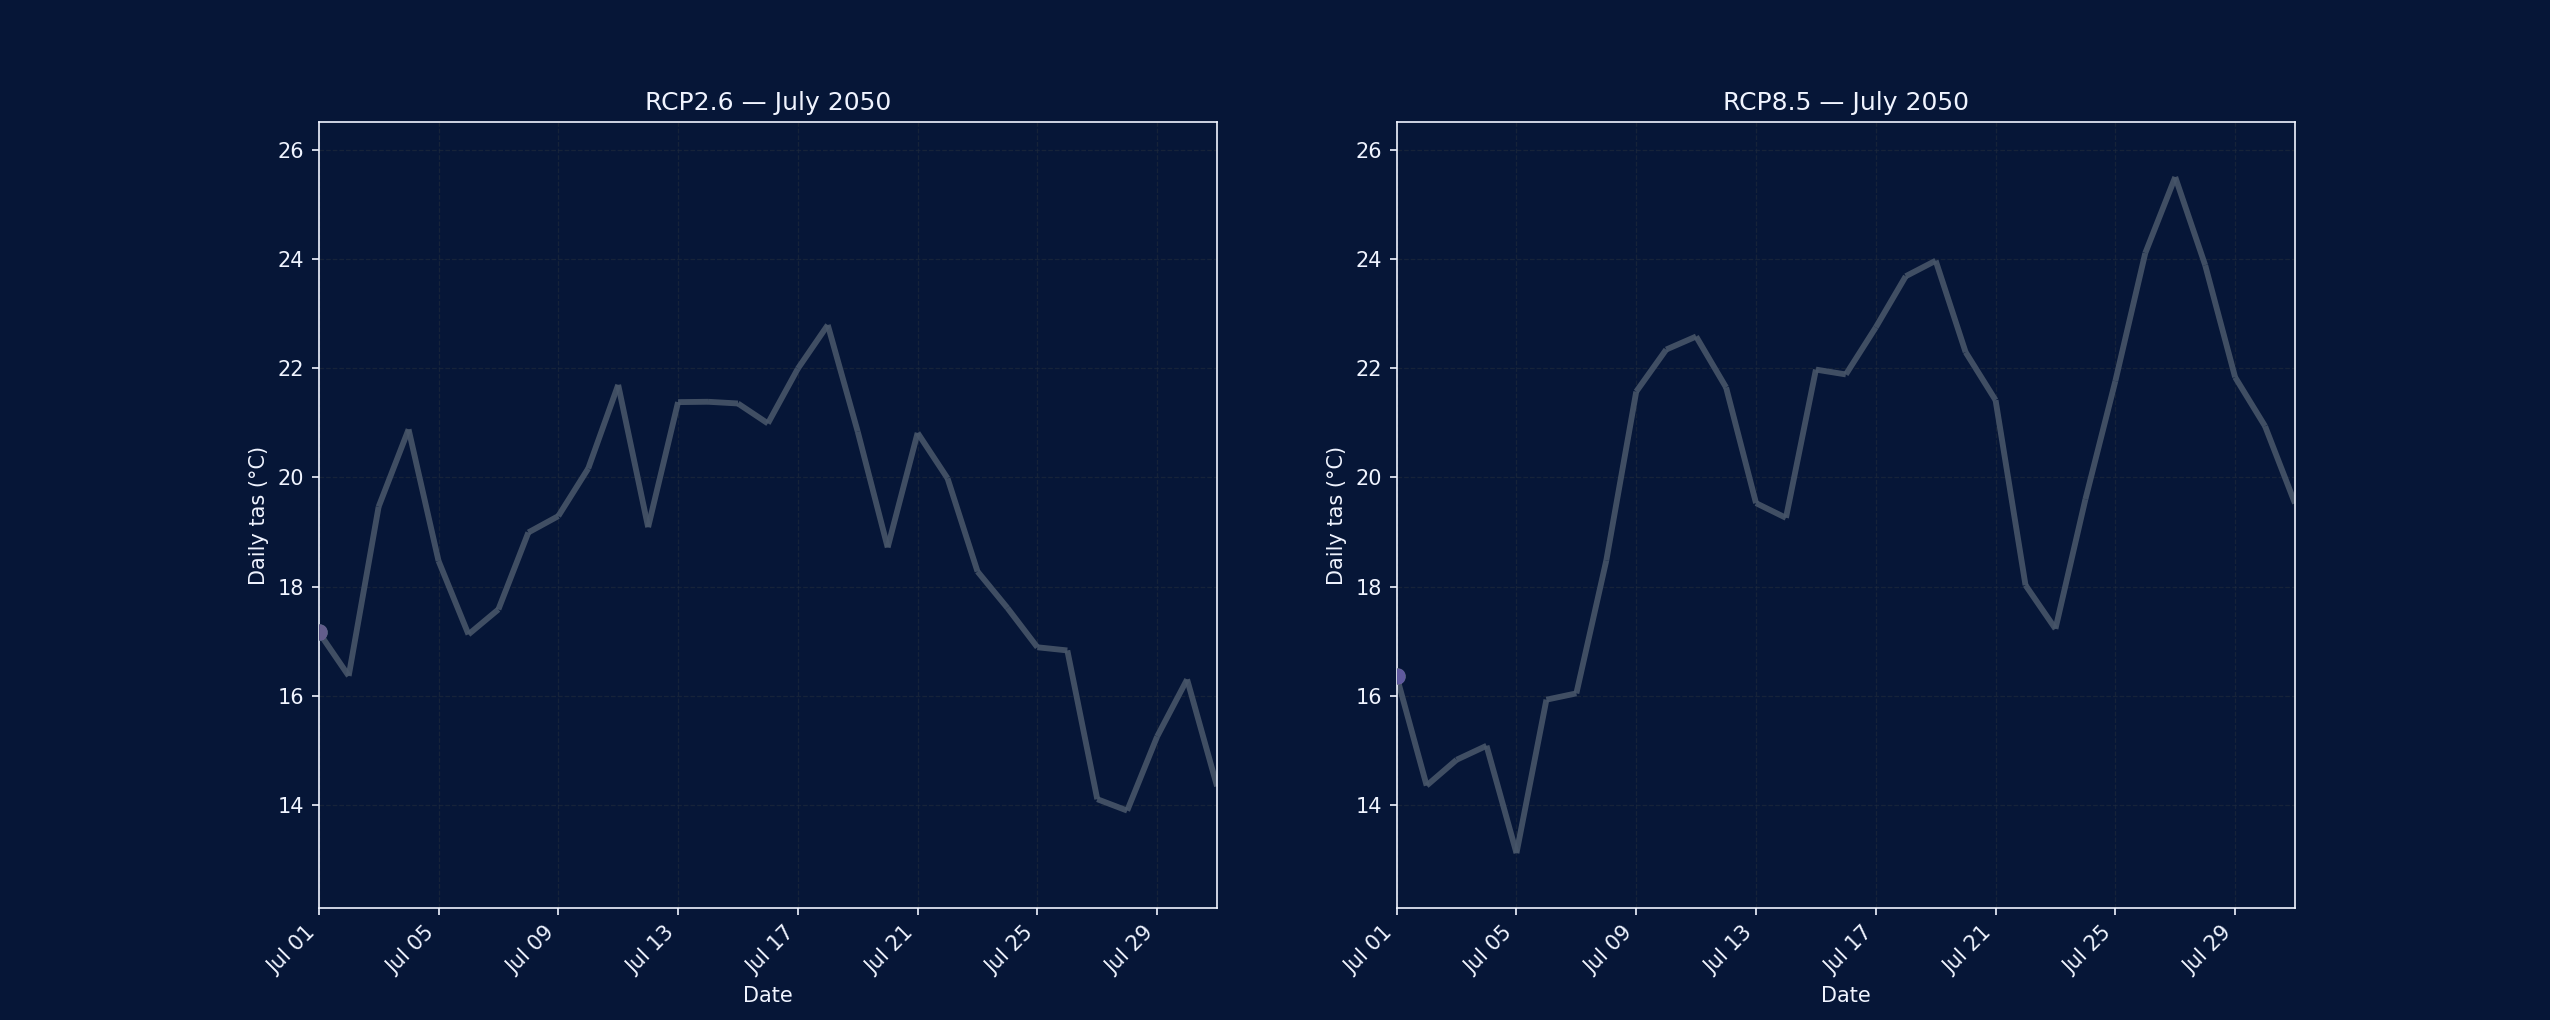
By 2050, the split between the two scenarios becomes prominent: RCP2.6 flattens during cooler spells, whereas RCP8.5 climbs faster and rarely relinquishes accumulated warmth—an indicator of longer-lasting heat events.
July 2075: Late-century extremes
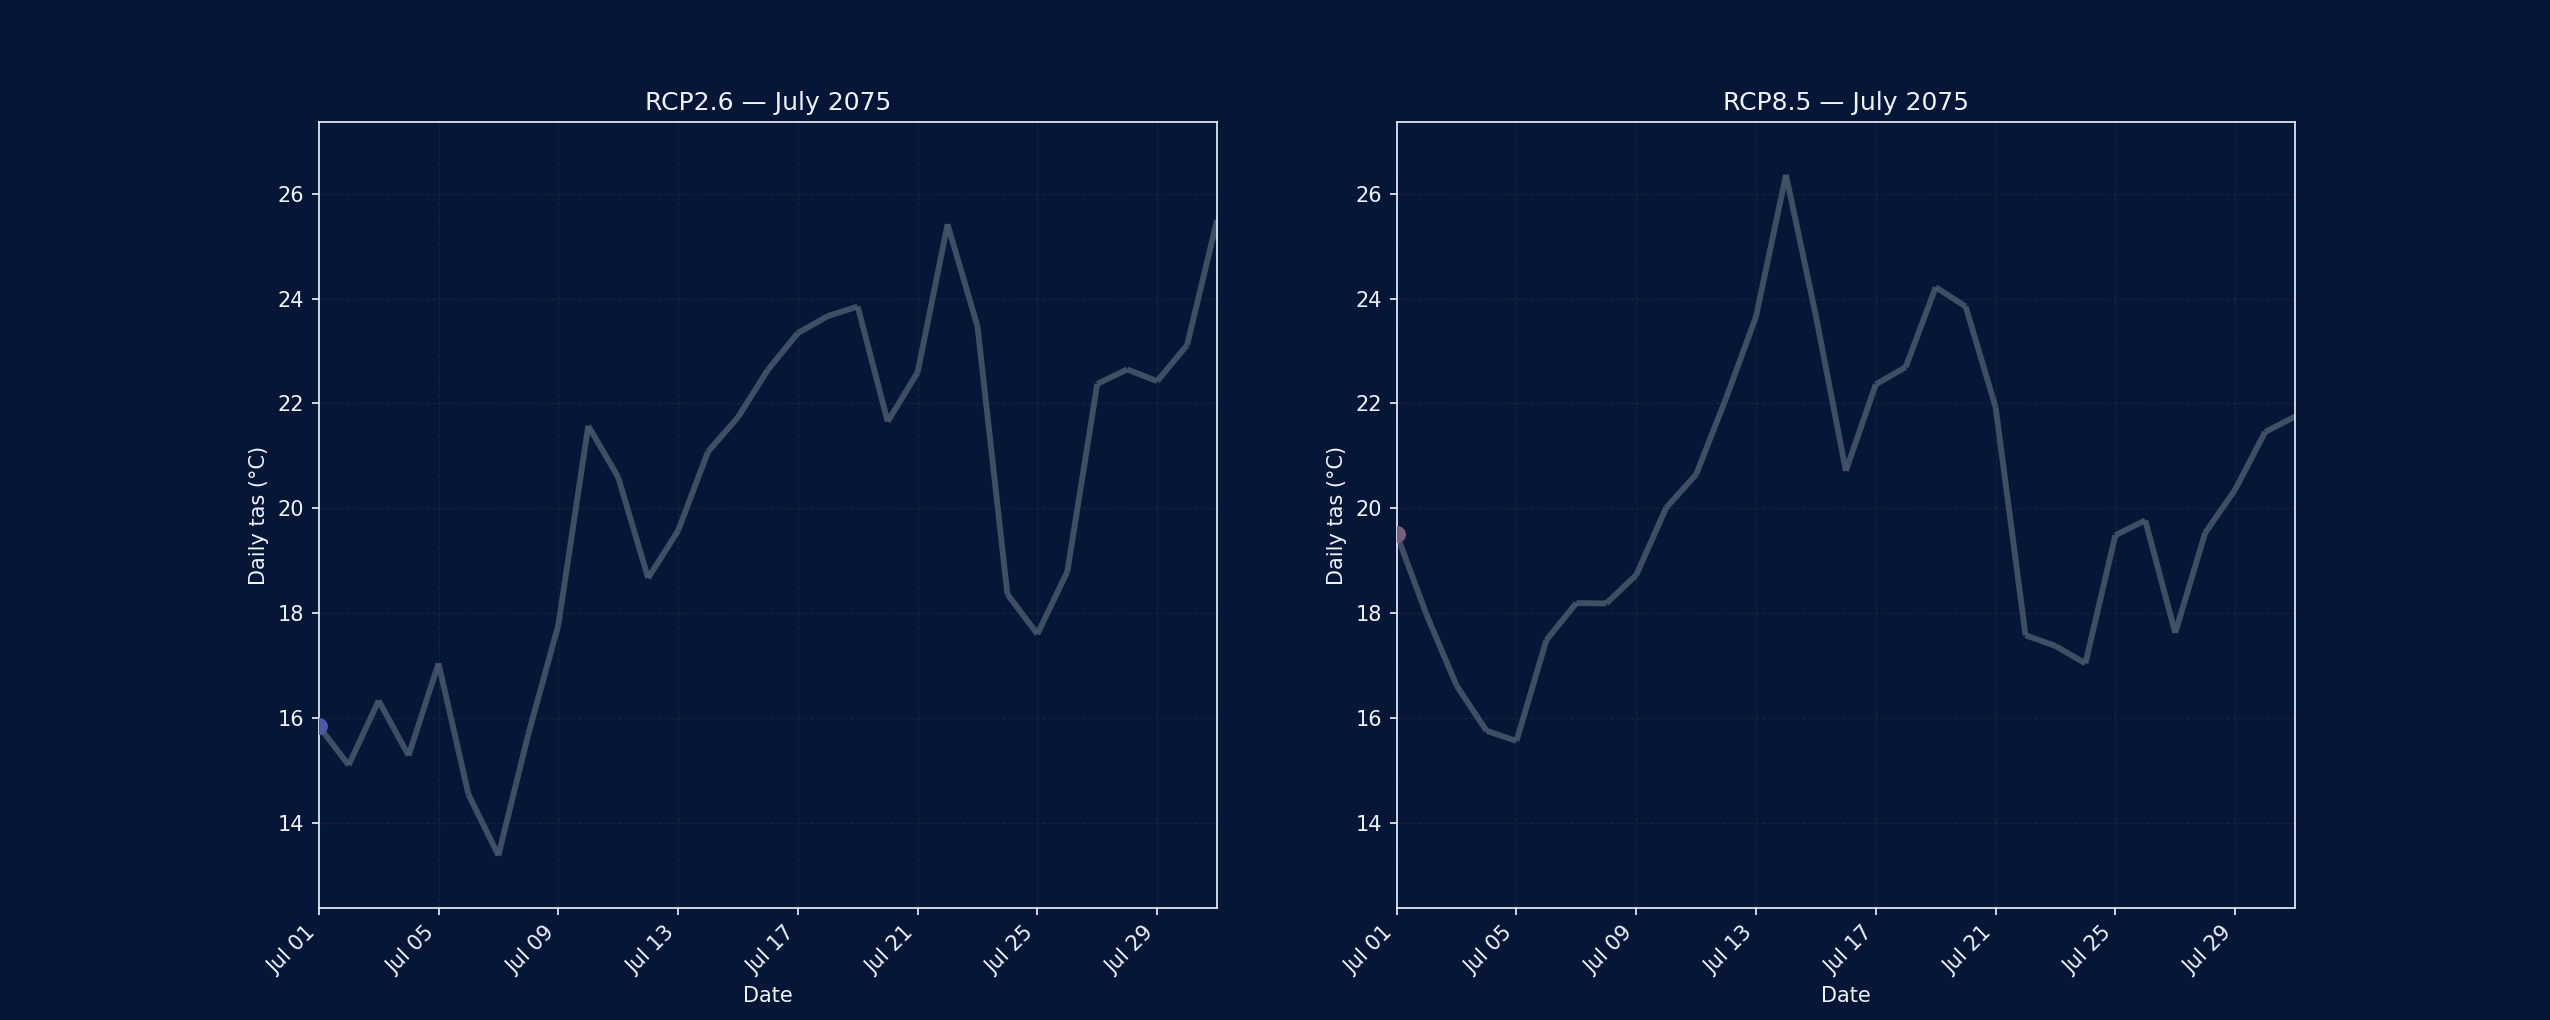
The 2075 animation captures the full spread in outcomes. Under RCP8.5, the line surges far above the RCP2.6 trajectory, illustrating how late-century summers risk sustained high temperatures even when short-lived cool spells appear.
- Posted on:
- October 22, 2025
- Length:
- 2 minute read, 256 words
- See Also: